Dashboards introduction
All information in Performance Store is either available directly by querying the Performance Store database, or visually through dashboards.
Performance Store comes with a multitude of dashboards. For individual descriptions of each dashboard see the Dashboards section in Documentation.


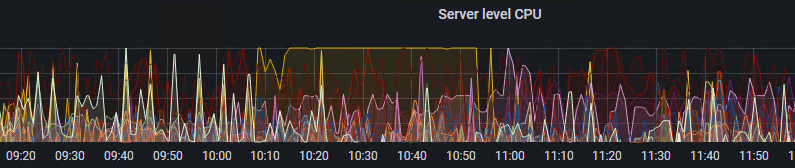
The visual dashboards gives a great “glass pane” overview of the SQL Server estate. It is easy to immediately see metrics even if monitoring thousands of databases.
The following shows how easy it is to visually identify a CPU problem among hundreds of SQL Servers:
Visual dashboards are presented through Grafana.
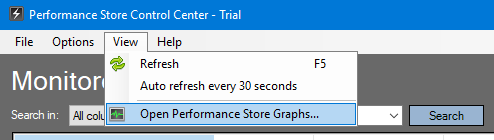
The dashboards can be accessed from Performance Store Graphs menu in the Performance Store Control Center:
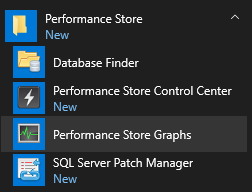
or from the Performance Store folder in the Start Menu:
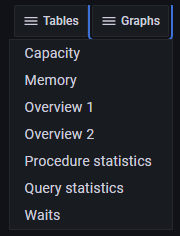
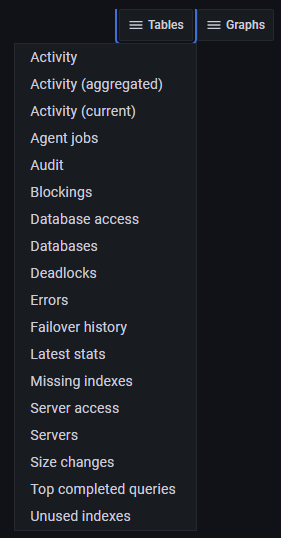
When viewing a dashboard, other dashboards can quickly be chosen from the menu in the upper right corner:
Logging in
When logging in to Grafana, do not use the domain name. E.g. use LHG and not DEV\LHG: