Memory dashboard
Shows information on memory clerks. Visual representation of the most common memory clerks are shown, as well as the top 5 memory clerks for each server pr. sample:
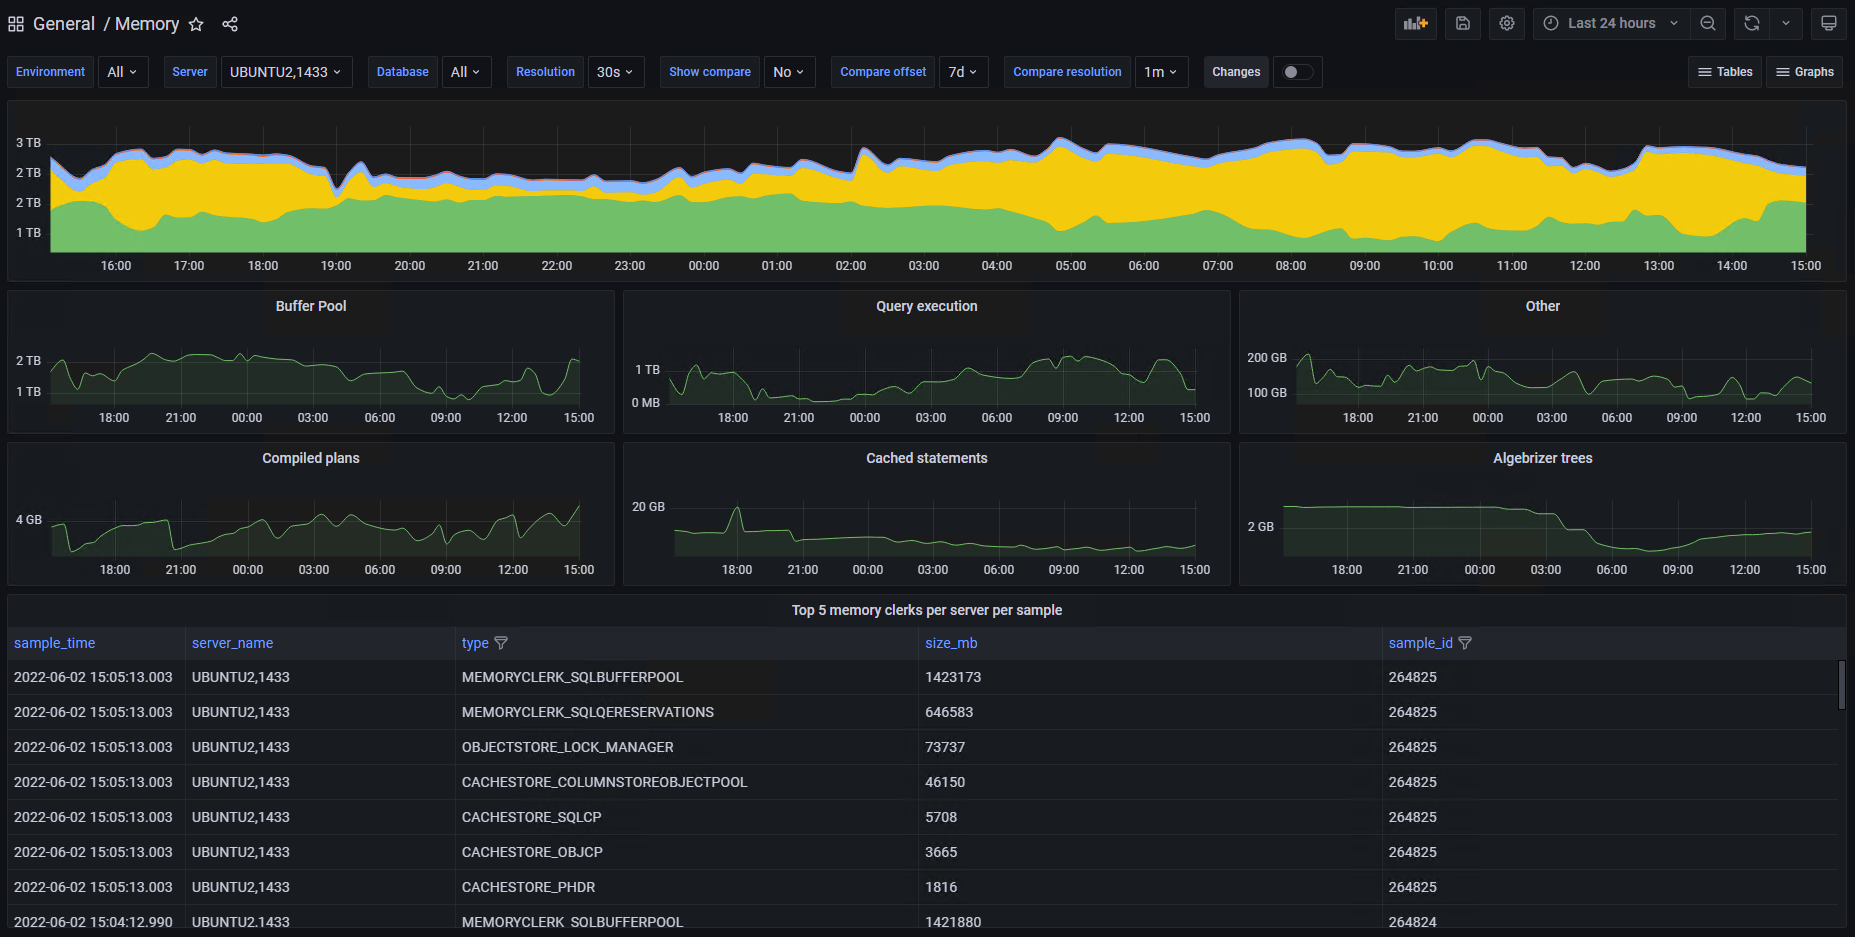
The standard memory clerks shown are: MEMORYCLERK_SQLBUFFERPOOL, MEMORYCLERK_SQLQERESERVATIONS, CACHESTORE_OBJCP, CACHESTORE_SQLCP, CACHESTORE_PHDR
Top memory consumers
On the Memory dashboard, it is also possible to see queries with multiple plans for the same query:

When multiple plans exists for the same query, the query could be a good candidate for parameterization.
To see the content of the plan cache, execute the following on the relevant server:
select cp.objtype, st.text, qs.execution_count, qs.query_hash, qs.query_plan_hash, p.query_plan, qs.creation_time, qs.last_execution_time, qs.total_logical_reads, qs.last_logical_reads, qs.min_logical_reads, qs.max_logical_reads, qs.total_elapsed_time, qs.last_elapsed_time, qs.min_elapsed_time, qs.max_elapsed_time, qs.total_elapsed_time / qs.execution_count avg_elapsed_time, cp.size_in_bytes, cp.cacheobjtype, qs.sql_handle, qs.plan_handle
from sys.dm_exec_query_stats qs
cross apply sys.dm_exec_sql_text(qs.sql_handle) st
cross apply sys.dm_exec_query_plan(qs.plan_handle) p
inner join sys.dm_exec_cached_plans cp on cp.plan_handle = qs.plan_handle
where qs.query_hash = [query_hash]
Memory usage
Performance Store calculates the maximum- and average memory consumption per server- and instance level. This information is very useful to see if memory should be adjusted on either instance- or server level.
E.g. if only 50 % of the instance memory is actually used, the max mem for the instance can be lowered. In addition, if all instance memory has been lowered and the actual used server memory is e.g. 50 %, then the physical memory in the server can be lowered.

On the dashboard it is also possible to see, if the memory in a server is overcommitted. In that case, this will be marked by a red line, and the value of the “memory_overcommitted” will be true. Memory is overcommitted if the combined sum of max mem for each instance on the server is above the physical memory in the server.
Corresponding views in the Performance Store database:
dbo.v_memory_clerks
dbo.v_memory_usage
dbo.v_multiple_plans
dbo.v_hist_memory_clerks
Other relevant views in the Performance Store database:
dbo.v_top_memory_clerks (shows the top 5 memory clerks per sample)
dbo.v_plan_changes (shows changes in plan operators over time. Great resource for detecting plan regression)