Overview 1 dashboard
Will show general statistics and performance metrics.
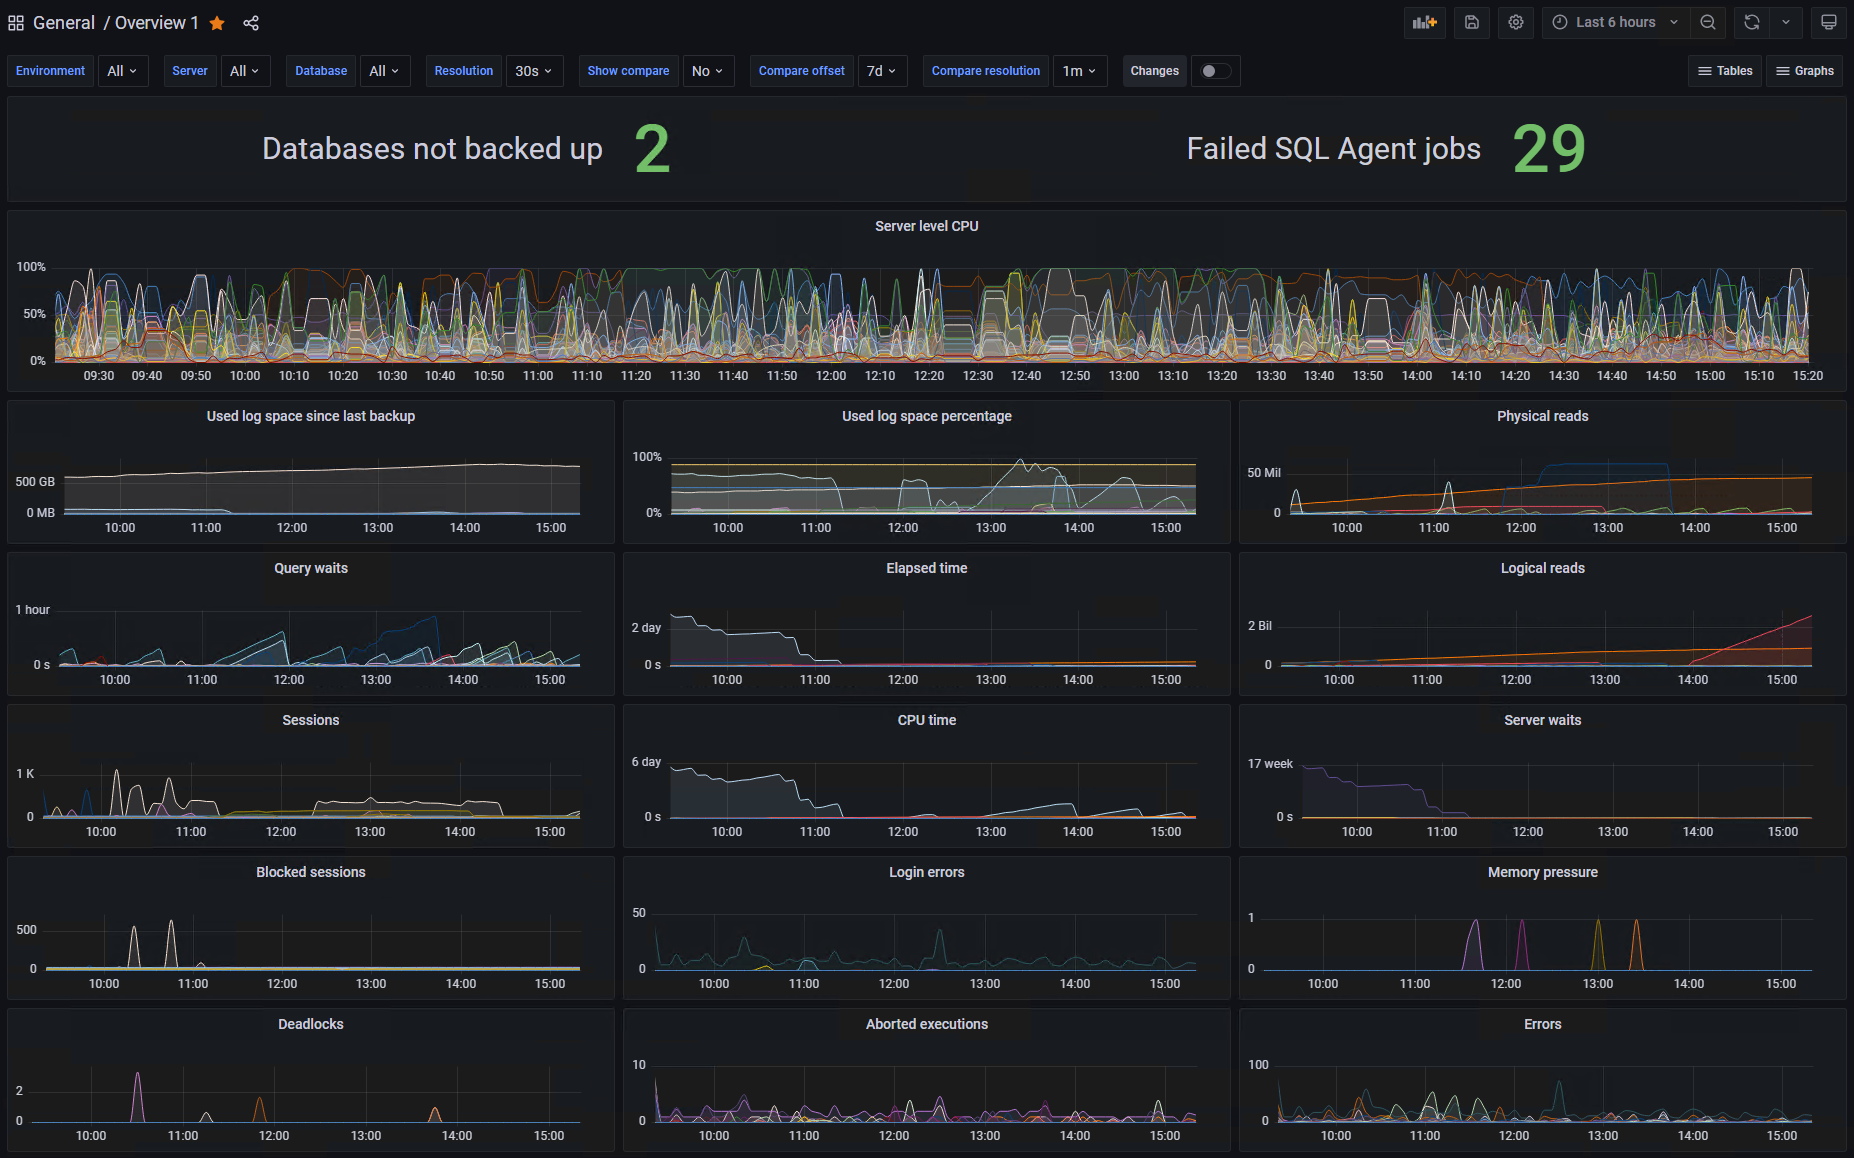
In the bottom part of the dashboard, all Critical- and High severity alerts for servers in production will be shown:
If no such alerts exists, a smiley will be shown:

Corresponding view in the Performance Store database:
dbo.v_activity_aggregated
dbo.v_servers
dbo.v_databases
dbo.v_latest_stats
dbo.v_wait_stats
dbo.v_memory_clerks
dbo.v_fileio_stats
dbo.v_performance_counters
dbo.v_capacity_data_and_log_drives
dbo.v_size_changes
dbo.v_procedure_stats_current
dbo.v_query_stats_current
dbo.v_latest_changes
dbo.v_hist_performance_counters
dbo.v_hist_memory_clerks
dbo.v_hist_login_errors
dbo.v_hist_errors
dbo.v_hist_deadlocks
dbo.v_hist_databases
dbo.v_hist_servers
dbo.v_hist_activity_aggregated
dbo.v_hist_aborted_executions