Waits dashboard
Overall wait statistics are presented in the top panel:
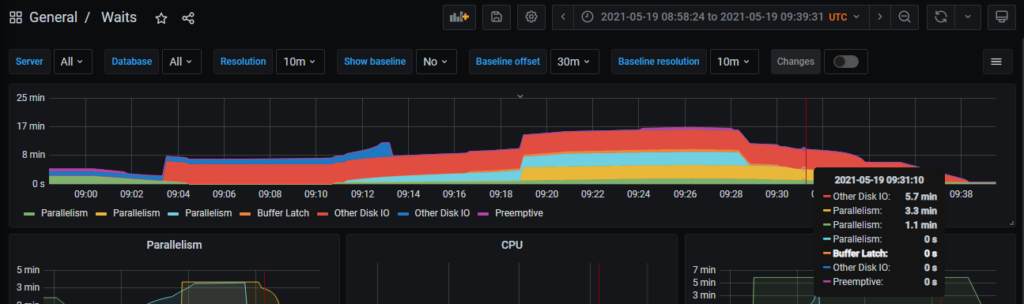
By hovering the mouse over an area, it can quickly be identified which areas are being waited on.
In the other panels, wait statistics for individual databases are shown, and more information can be shown by hovering the mouse over the graphs:
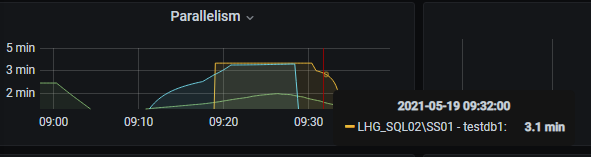
Wait types are grouped in categories to make it easier to directly see what types of waits are more prevalent than others. Each group is represented by a graph.
To see the top 5 individual wait types for the different categories:

To exclude specific waits from being collected, set the value of the ignorable column to 1 in the dbo.waits table.
Corresponding view in the Performance Store database:
dbo.v_wait_stats
dbo.v_hist_wait_stats
Other relevant views in the Performance Store database:
dbo.v_top_wait_stats (shows the top 5 wait stats per sample)
dbo.v_latch_stats