Timeouts dashboard
The Timeouts dashboard contains information about when Performance Store operations times out:
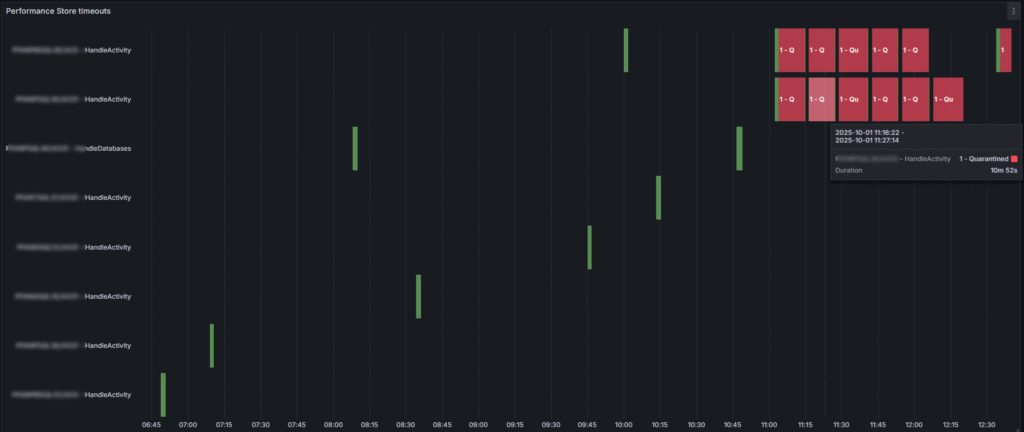
When a server is heavily under pressure, Performance Store might not be able to either get a connection to the server, or get information about specific areas on the server. These areas are called locations. If metrics or data is missing on a server in a specific time period, it might be due to Performance Store not being able to work with the server. This can be seen on the Timeouts dashboard. Performance Store might not be able to sample activity data, but might be able to work in all other areas. In such a case, a timeout for the “HandleActivity” location will occur.
Rules for when Performance Store should register a timeout can be set in the Performance Store Control Center. When a timeout occurs repeatedly, the corresponding location will be quarantined. By default two concurrent timeouts in the same location will result in a quarantine for that particular location:

If the sum of collection data from all areas (locations) exceeds 60 seconds (default value), a “total collection timeout” will occur:

Even if timeouts occur, data will still be collected when the server is accessible again for Performance Store. This does not include sample based collection data like e.g. activity data. Data like top completed queries, errors, audit etc. will be collected eventually even if the server is in timeout in these locations.
Note, these timeouts are only related to Performance Store, and does not reflect e.g. generel user query timeouts in the databases on the servers.
If Performance Store consistently is having a hard time collecting data in a specific area on a server, optimizing collection performance might help.
Corresponding views in the Performance Store database:
dbo.v_timeouts
dbo.v_timeout_history