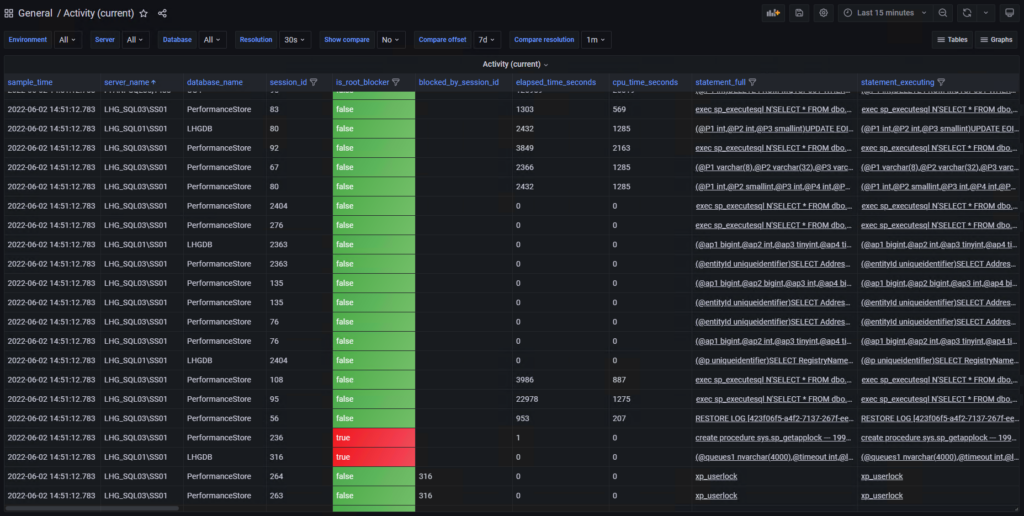
Activity (current) dashboard
One of the most widely used dashboards.
Will show the current activity for the selected SQL Servers and databases. If a query is blocking other queries, but the query itself is not blocked, it is considered a root blocker, and will be shown in the is_root_blocker column. If a query is a root blocker, the color of the column will change to red for for quick visual identification.

The dashboard includes a column named “estimated_percent_complete”. Performance Store will analyse the live execution plan for queries, and derive information about how many rows has been processed for each plan operator. This is held up against the statistics for the tables involved in the query, giving information about how many rows has been processed out of an estimated totalt amount of rows. Based on this information, an “estimated_percent_complete” value can be generated. Note, this value can be much higher than 100%. In such a case, this is a good indication that the statistics are skewed.

Since live execution plans are analyzed, Performance Store collects other useful information e.g. number of scans and seeks for each execution of a query. Since history information is available, it is a great way to see if plan regression or parameter sniffing is happening (custom stats can be created to trigger alerts if e.g. a query suddenly uses 80% more seeks than usual):

To see historical activity data use the Activity dashboard, and to see historical data aggregated use the Activity (aggregated) dashboard.
Query plans are available on the dashboard and the database views.
Corresponding view in the Performance Store database:
dbo.v_current_activity
Other relevant views in the Performance Store database:
dbo.v_activity (shows historic activity information)
dbo.v_activity_aggregated (shows aggregated activity information)
dbo.v_top_completed (shows information about completed or aborted queries – not sample based)