Top completed queries dashboard
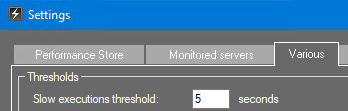
Shows all completed queries with a duration equal to or greater than the “Slow execution threshold” value (default 5 seconds) set in the Performance Store Control Center:
Queries with a duration of less than the “Slow execution threshold” will only be shown in the Top completed queries dashboard if the execution fails.
All queries are shown in this dashboard, and not only active queries running while Performance Store is sampling a server. This means, even queries running while Performance Store is not running (if e.g. Performance Store is down for maintenance) will still show in this dashboard.
Since this dashboard shows completed queries, it is possible to see if a query has timed out or did not execute due to an error.


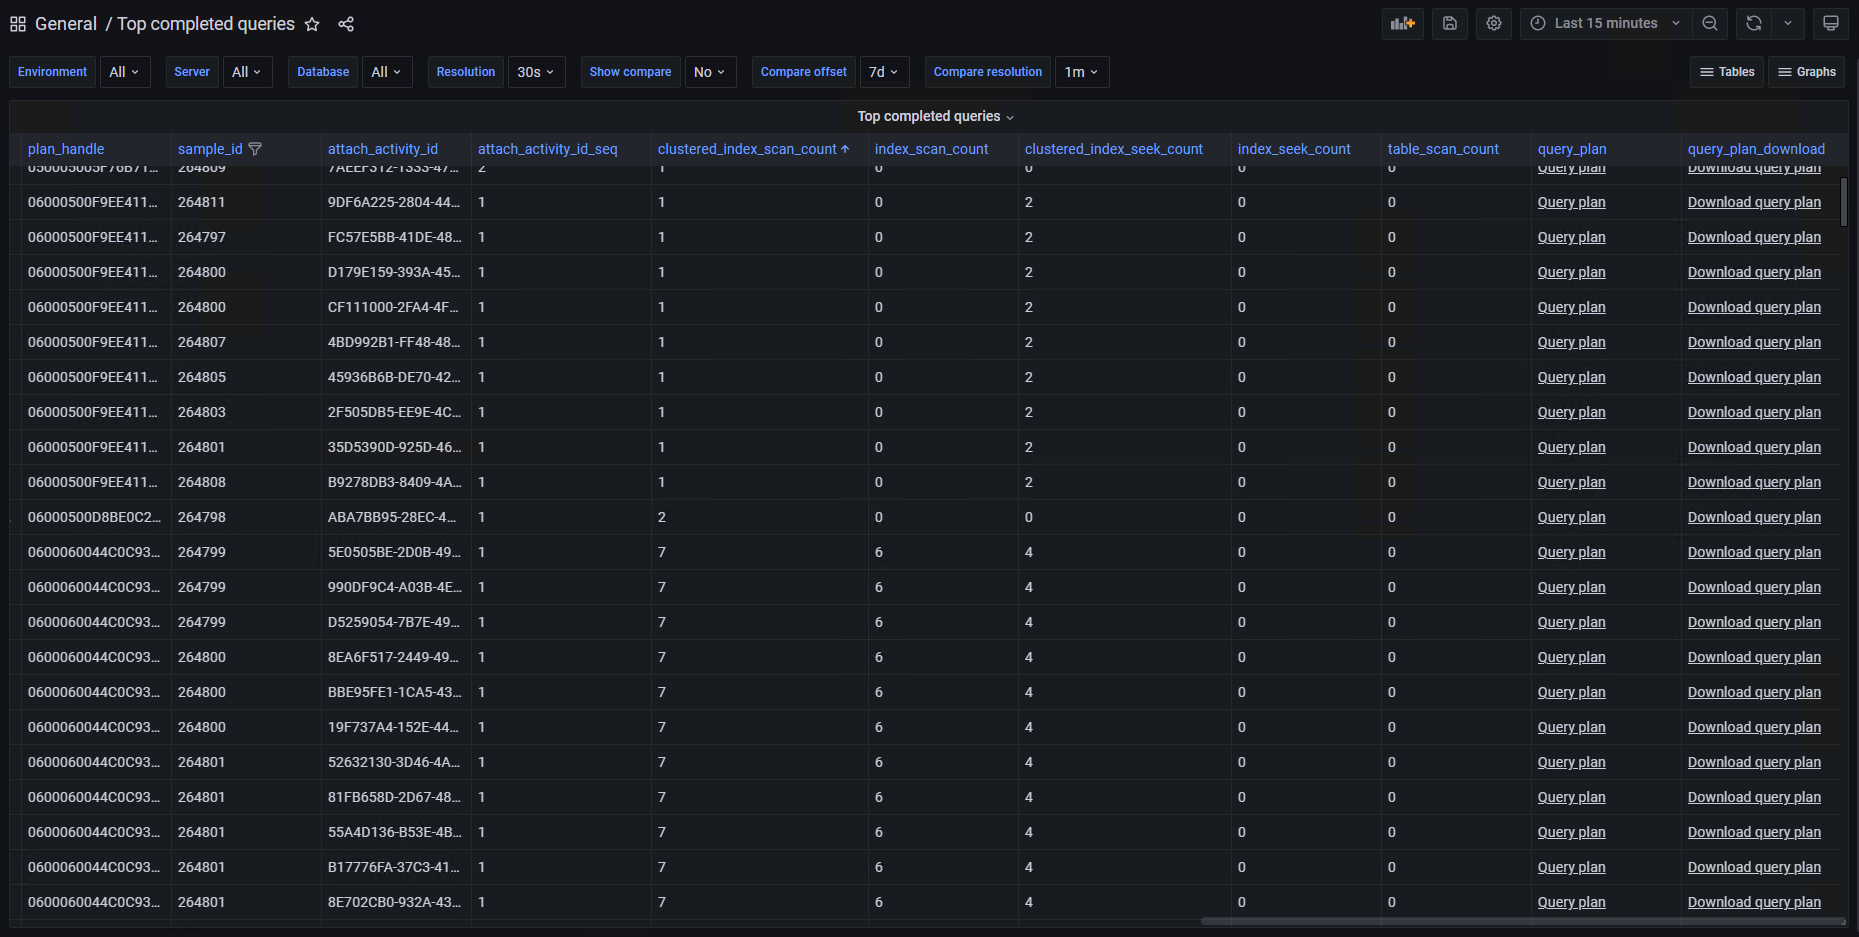
Query plans are available on the dashboard and the database views.
Corresponding view in the Performance Store database:
dbo.v_top_completed
Other relevant views in the Performance Store database:
dbo.v_activity