Alerting
Performance Store comes with many built-in alerts. Alerts are fully customizable and custom alerts can be created.
Alerts can be created to trigger on certain events (e.g. CPU usage above 80 percent), and rules can be defined (e.g. CPU usage should be above 80 percent for 3 minutes without any drops below 80 percent). Alerts can be triggered on a change in delta values e.g.:
- an agent job run duration deviates more than 30 percent from the average run duration
- a login has been granted sysadmin rights
Alerts can be created for any data available in Performance Store.
Alerting channels
Performance Store is having native support for sending alerts to the following channels:
- Atlassian Opsgenie
- Microsoft Teams
- PowerShell
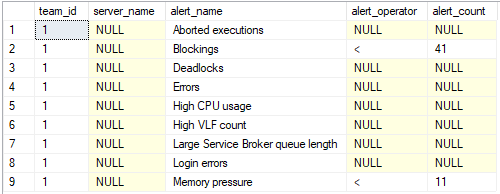
Alerting channels are set up in the dbo.team_alert table.
When sending alerts to a mail target, alerts will be grouped in the same mail to avoid sending one email per alert.
When integrating with Opsgenie, alerts will automatically be closed in Opsgenie when the alert is no longer triggered by Performance Store.
Alerting channel teams
Different alerting channels are defined by alerting channel teams. Each team can have different alert triggers.
By default all alerts are send out to the alerting channels. If alerts should be ignored and not send out to specific teams, rules can be configured in the dbo.team_alert_exclude table:
alert_operator can be: <, > and =
To only get specific alerts or only alerts for specific servers, add them to the dbo.team_alert_include table.
Alerting channel teams are useful for e.g. directing alerts for specific servers to specific teams. One team might prefer to get alerts on Microsoft Teams and email, while another team might prefer to receive alerts only in ServiceNow.
Alerts
Alerts are defined in the dbo.alerts table:
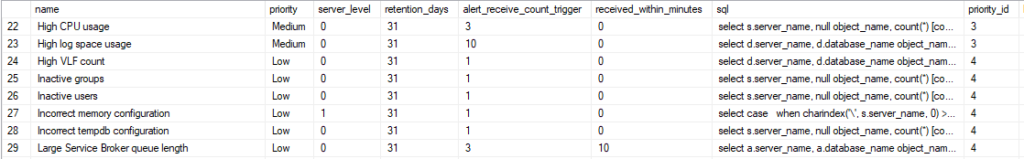
If “received_within_minutes” is 0, an alert is thrown if the alert is triggered consequently within the last [alert_receive_count_trigger] samples.
Example: If an alert should be be thrown if 3 concurrent occurrences has happened, set the value of alert_receive_count_trigger to 3.
If “received_within_minutes” is different from 0, an alert is thrown if the alert is triggered [alert_receive_count_trigger] number of times within the last [received_within_minutes] minutes.
Example: If an alerts should be thrown if 3 occurrences has happened within 10 minutes, set the value of received_within_minutes to 10.
All alerts contains a link to the Performance Store documentation about the alert. Custom alerts can also include an optional link. This value is set in the link column in dbo.alerts.
An alert is only send once while it is relevant. That means, when the criterias for throwing an alert is met, the alert is thrown. For similar subsequent events, alerts are not thrown even if they are fulfilling the criterias. This is to prevent the same alert to be thrown again and again, e.g. if a SQL Agent job fails, an alert is not send every minute. Before a new alert is thrown for the failed SQL Agent job, a successful execution of the SQL Agent job must have taken place.
If the alerts is still exists after the number of days stated in [retention_days], the alert will be rethrown. This is to ensure, that no alerts will be forgotten. The rethrow will occur every number of days stated by [retention_days].
If [retention_days] is -1, the alert will not be rethrown.
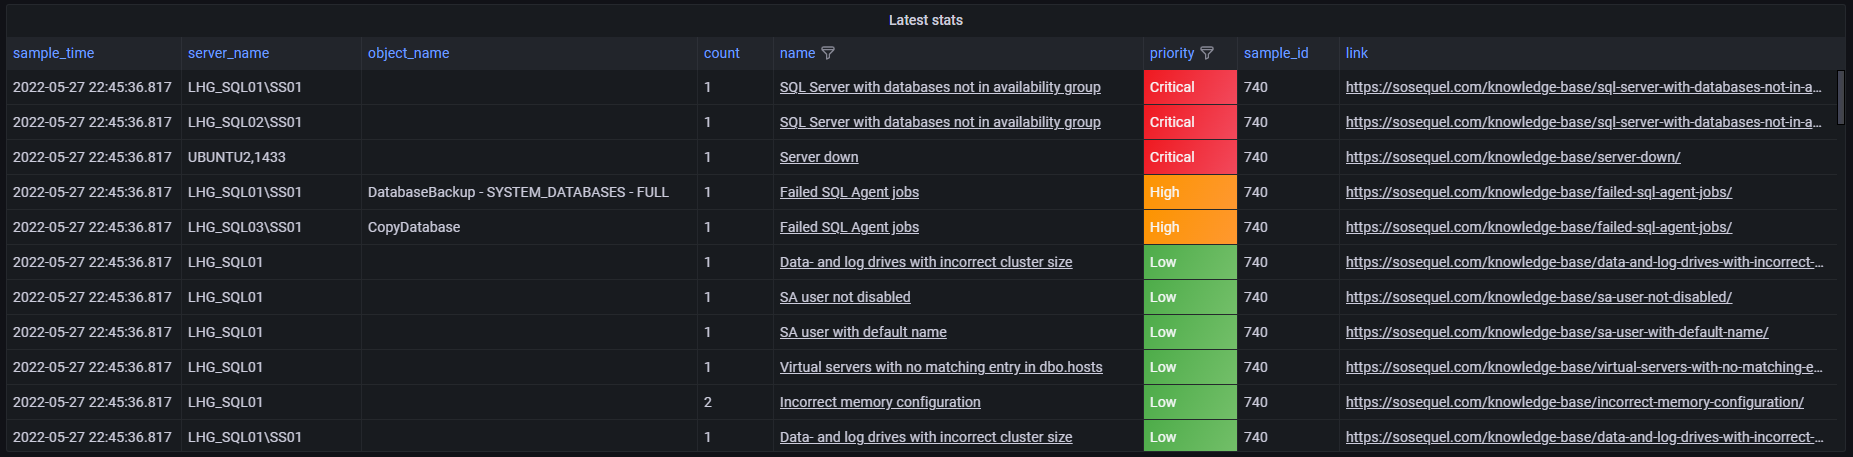
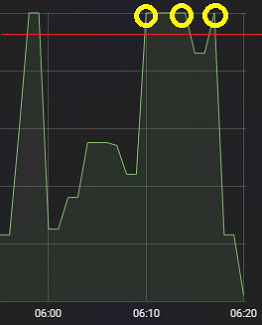
Alerts with a priority of Critical or High, will be shown on the dashboard if the alerts are thrown on production servers.
Example on how to see latest “High CPU usage” alerts for “LHG_SQL01\SS01”:
select s.*
from dbo.v_latest_stats s
where 1 = 1
and s.server_name = 'LHG_SQL01\SS01'
and s.name = 'High CPU usage'
To see alerts that is partially fulfilling a criteria, but have not yet been thrown:
select a.*
from dbo.alert_status a
where 1 = 1
and a.server_name = 'LHG_SQL01\SS01'
and a.name = 'High CPU usage'
To see thrown alerts:
select al.*
from dbo.alert_log al
where 1 = 1
and al.server_name = 'LHG_SQL01\SS01'
and al.name = 'High CPU usage'
Custom alerts
Custom alerts can be created by adding rows to dbo.alerts.
When doing so, set the value of is_system to 0.
Alerts are defined by the t-sql statement in the sql column in dbo.alerts. The t-sql statements must have the following 3 columns: server_name, object_name, count
Example
To create a custom alert, alerting if a database is on a SQL Server 2019, but the compatibility level has not been set to 150, use the following t-sql statement in the sql column:
select s.server_name, d.database_name object_name, 1 [count]
from dbo.v_servers s
inner join dbo.v_databases d on d.server_name = s.server_name
where substring(s.sql_server_version, 1, charindex('.', s.sql_server_version) - 1) = 15
and d.compatibility_level != 150
group by s.server_name, d.database_name
The count column defines how many occurrences that should be reported as a part of the alert, but as databases are unique on each SQL Server, the value is set to 1 in the above example.
Performance Store comes with the following 3 example custom alerts that are all disabled by default:
- Full backups older than expected
- Diff backups older than expected
- Log backups older than expected
These can freely be modified and enabled.
See Creating a custom alert for a walkthrough in creating a custom alert.
Sending alerts to PowerShell
Alerts can be send to a PowerShell script, and from there integrated into other application and services.
The path to the PowerShell file is set in the dbo.team_alert table in the powershell_script_path column.
When alerts are fired, the PowerShell file is then called.
Example of a PowerShell script file:
param([string]$alertType, [string]$sampleId, [string]$sampleTime, [string]$serverName, [string]$objectName, [string]$count, [string]$name, [string]$link, [string]$priority, [string]$retentionDays)

[string]$message = [string]::Format("AlertType: {0}`r`nSampleId: {1}`r`nSampleTime: {2}`r`nServerName: {3}`r`nObjectName: {4}`r`nCount: {5}`r`nName: {6}`r`nLink: {7}`r`nPriority: {8}`r`nRetentionDays: {9}", $alertType, $sampleId, $sampleTime, $serverName, $objectName, $count, $name, $link, $priority, $retentionDays)

[string]$logFile = "C:\Temp\Alert_$((Get-Date).ToUniversalTime().ToString("yyyyMMdd_HHmmss")).txt"
Write-Output $message | Out-File $logFile
Example of using a PowerShell script file to create a Windows Event log entry on the affected machine:
param([string]$alertType, [string]$sampleId, [string]$sampleTime, [string]$serverName, [string]$objectName, [string]$count, [string]$name, [string]$link, [string]$priority, [string]$retentionDays)
[string]$message = [string]::Format("AlertType: {0}`r`nSampleId: {1}`r`nSampleTime: {2}`r`nServerName: {3}`r`nObjectName: {4}`r`nCount: {5}`r`nName: {6}`r`nLink: {7}`r`nPriority: {8}`r`nRetentionDays: {9}", $alertType, $sampleId, $sampleTime, $serverName, $objectName, $count, $name, $link, $priority, $retentionDays)

function GetServerNameWithoutInstance
{
	param([string]$serverName)

	$serverNameWithoutInstance = $serverName

	if ($serverName.Contains("\"))
	{
		$serverNameWithoutInstance = $serverName.Substring(0, $serverName.IndexOf("\"))
	}
	elseif ($serverName.Contains(","))
	{
		$serverNameWithoutInstance = $serverName.Substring(0, $serverName.IndexOf(","))
	}

	return $serverNameWithoutInstance
}

$serverNameWithoutInstance = GetServerNameWithoutInstance -serverName $serverName

$sourceName = "Performance Store"
$eventId = 3001

$script =
{
	param([string]$sourceName, [string]$serverNameWithoutInstance, [string]$message, [string]$eventId)

	if (-not [System.Diagnostics.EventLog]::SourceExists($sourceName, $serverNameWithoutInstance))
	{
		New-EventLog -ComputerName $serverNameWithoutInstance -LogName "Application" -Source $sourceName
	}

	Write-EventLog -LogName "Application" -Source $sourceName -EntryType Error -EventID $eventId -Message $message
}

Invoke-Command -Computer $serverNameWithoutInstance -ScriptBlock $script -ArgumentList $sourceName, $serverNameWithoutInstance, $message, $eventId
Sending alerts to Opsgenie
Performance Store integrates directly into Opsgenie.
If sending alerts to Opsgenie, new alerts from Performance Store will automatically be created as new alerts in Opsgenie. When an alert is no longer active in Performance Store, the corresponding alert will automatically be closed in Opsgenie.
In many monitoring systems, alerts are handled one-to-one meaning if an alert is created, the alert will be closed when the original alert has been solved. Due to the nature of Performance Store, not only one-to-one alerts will be closed, but also dependent alerts.
The following example shows how dependent alerts works:
A server is experiencing high memory pressure and high CPU usage, and two alerts are thrown – one for memory pressure and one for high CPU usage.
The server crashes and creates a third alert for the server crash.
When the server is up running again, it is no longer experiencing memory pressure or high CPU usage, so all three alerts will be marked as solved even though only one of them (the server crash) was actively handled. In this case, the alerts for memory pressure and high CPU usage is no longer relevant, and is not required to be manually closed, as they have already been automatically closed by Performance Store.
Note, the correct Opsgenie API url must be set in the Settings menu. Depending on the region, the value for “OpsGenieUrl” must be:
- For european countries: https://api.eu.opsgenie.com/v2/alerts
- For non-european countries: https://api.opsgenie.com/v2/alerts
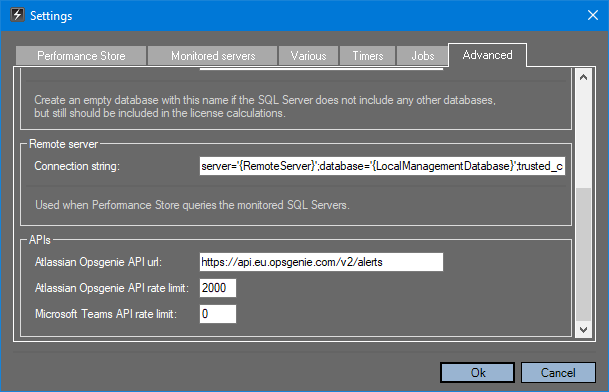
Depending on the Opsgenie plan, the value for “Atlassian Opsgenie API rate limit” should be set accordingly in the Settings menu. Default value is 2000 which correspond to a free Opsgenie plan.
Built-in alerts
By default, Performance Store can send alerts if any of the following events occurs:
- Aborted executions
- Agent job differences
- Agent not running
- Audit not enabled
- Auto close is on
- Auto shrink is on
- Availability Group failover
- Blockings
- Collation mismatch
- Data drive with incorrect cluster size
- Database differences
- Database role member added
- Databases not backed up
- Deadlocks
- Diff backups older than expected
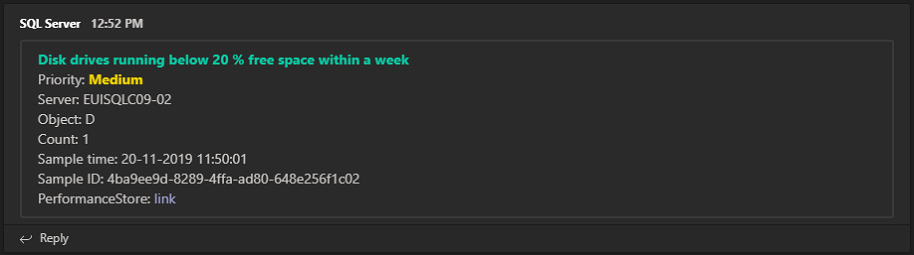
- Disk drives running below 20 % free space within a week
- Disk drives running empty within a week
- Disk drives with less than 20 % free space
- Disk latency too high
- Drive differences
- Errors
- Failed SQL Agent jobs
- Full backups older than expected
- High CPU usage
- High log space usage
- High row count change
- High VLF count
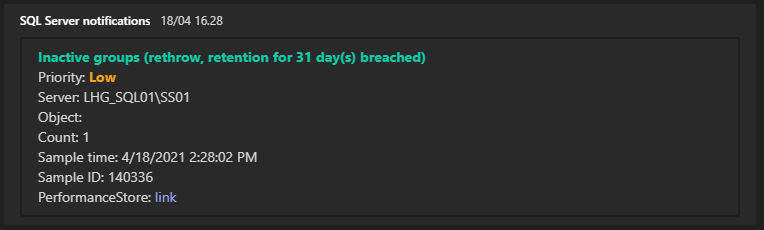
- Inactive groups
- Inactive users
- Incorrect memory configuration
- Incorrect tempdb configuration
- License increase
- Log backups older than expected
- Log drive with incorrect cluster size
- Login errors
- Memory pressure
- Non-copy-only snapshot backups are taken
- Non-equal file growth detected
- Non-existing default database for user
- Non-healthy database availability group state
- Plan cache can be optimized
- Primary and secondary placed on same host
- Primary- and secondary availability groups on same server
- Redo queue size above threshold
- Replicas with non-identical service accounts
- SA user not disabled
- SA user with default name
- Server configuration differences
- Server differences
- Server role member added
- Server securables differences
- Server security differences
- Server unreachable
- SQL Server with databases not in availability group
- Sysadmins added
- Sysadmins removed
- Transaction log full
- Unused CPUs
- Unused databases
- Virtual servers with no matching entry in dbo.hosts
- Virtual servers without a host_name set
- Wrong Agent Job owner
- Wrong availability group owner
- Wrong database owner
- Wrong mirroring endpoint owner