Procedure statistics dashboard
Shows statistics for all stored procedure executions:
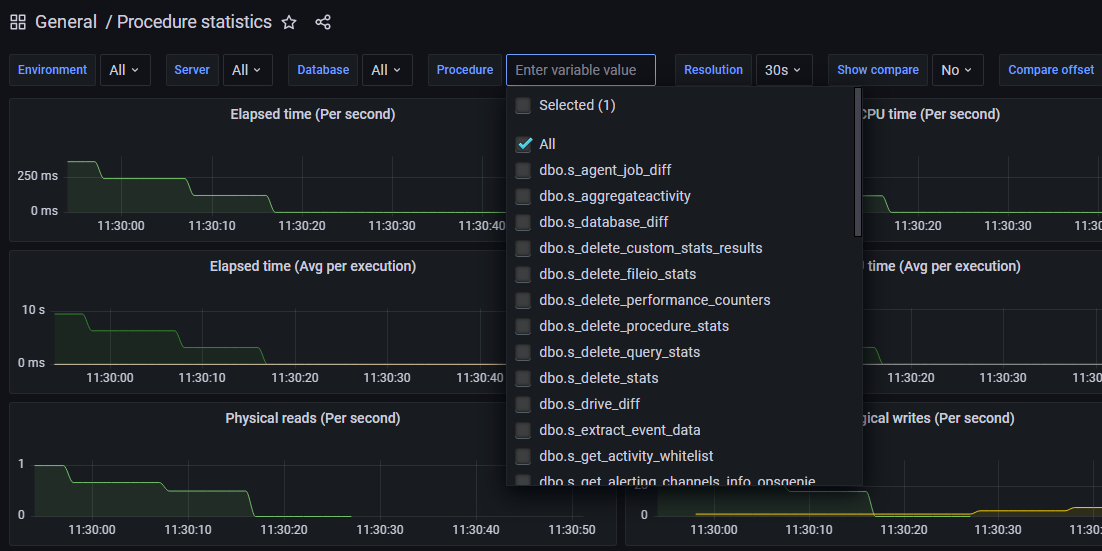
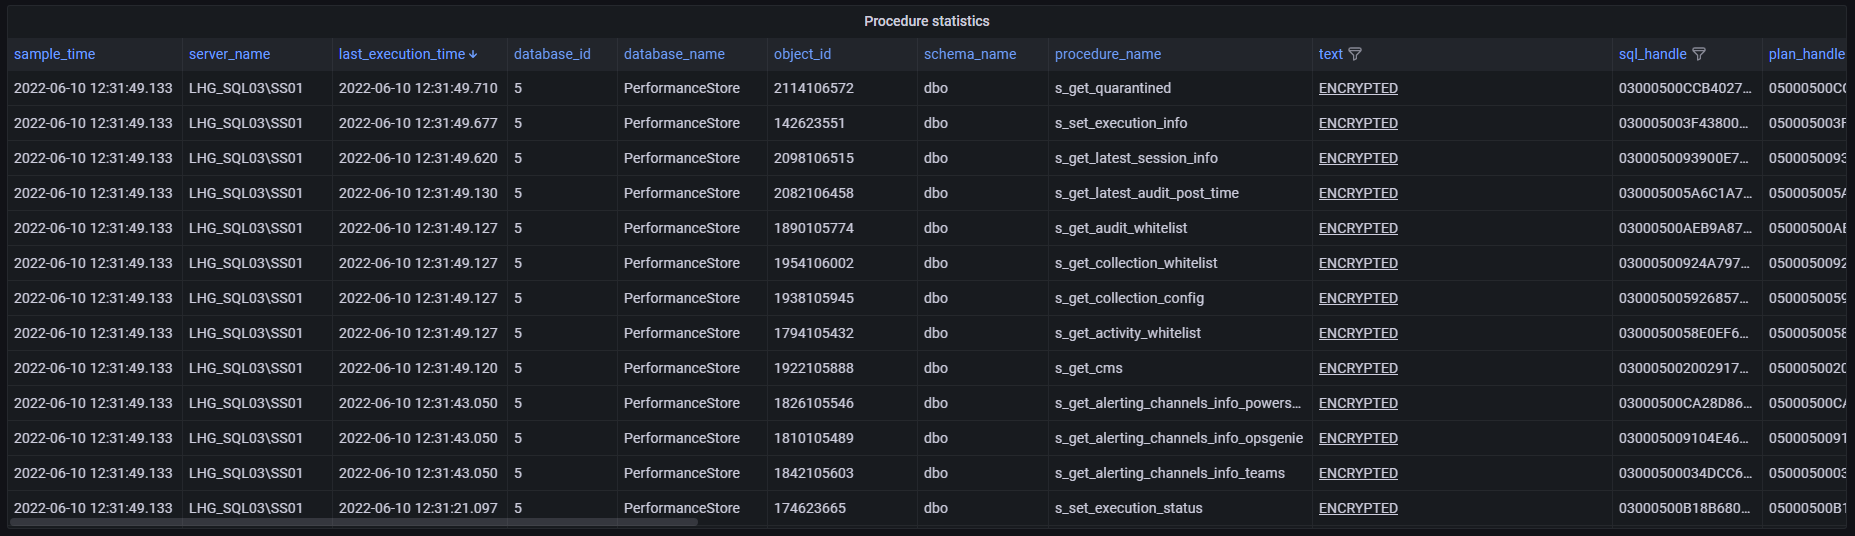
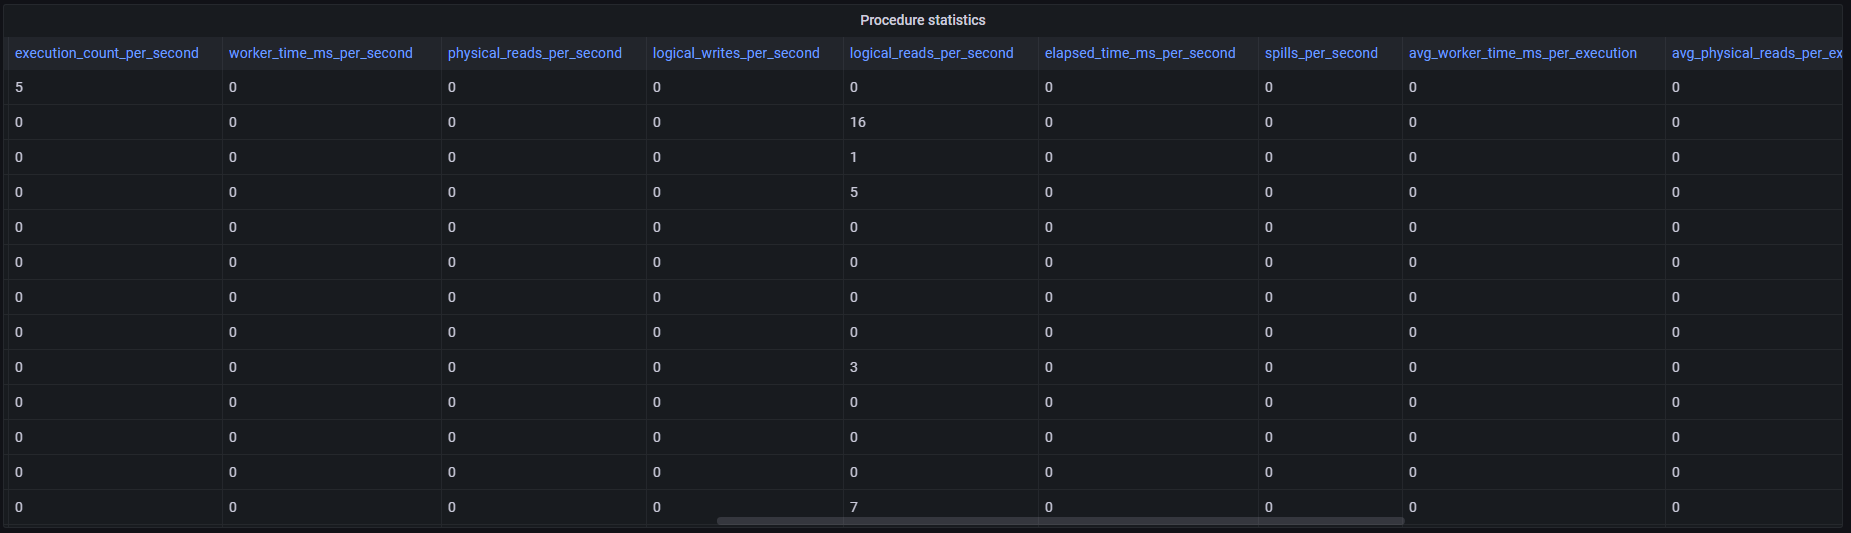
Information about every stored procedure execution can be seen:
Here it will be possible to e.g. compare performance metrics for a stored procedure with a baseline:

Information about every stored procedure execution can be seen:
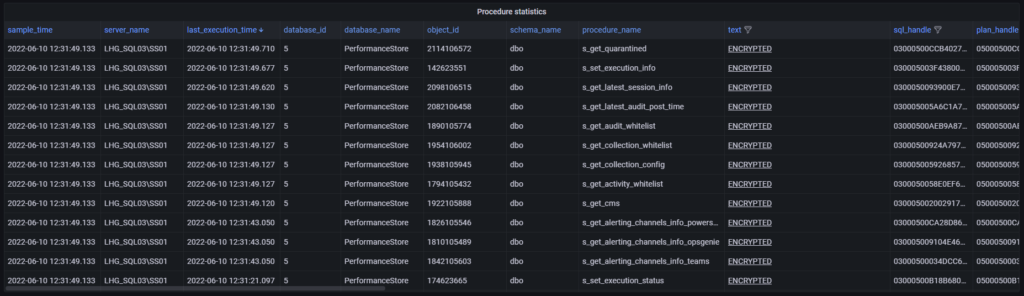
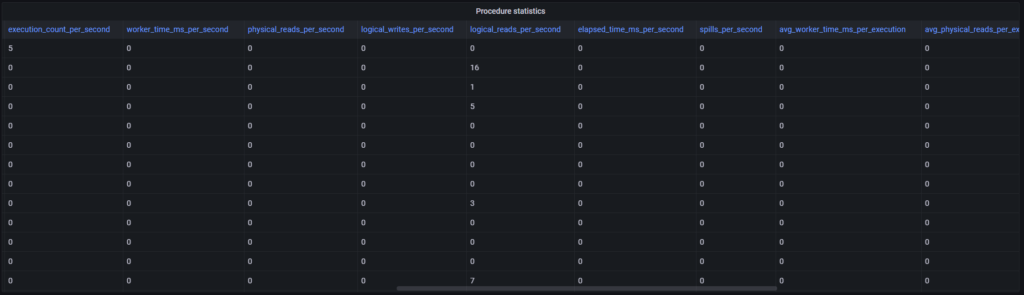
Here it will be possible to e.g. compare performance metrics for a stored procedure with a baseline:
Procedure statistics (aggregated) dashboard
In addition to the “Procedure statistics” dashboard, another dashboard “Procedure statistics (aggregated)” exists. This dashboard shows aggregated statistics over the chosen time period, e.g. if the chosen time period is 24 hours, it will show aggregated statistics for each procedure executed in the chosen 24-hour time interval.
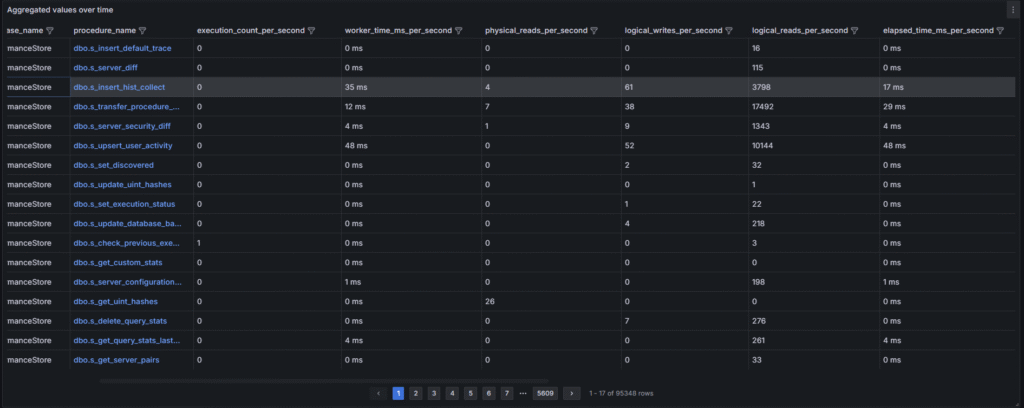
Click on the value in the procedure_name column to go directly to the graph view for the particular procedure, to see how it has performed historically over time.
Corresponding view in the Performance Store database:
dbo.v_procedure_stats
dbo.v_procedure_stats_current (shows procedure stats for the latest sample)
dbo.v_hist_procedure_stats
Other relevant views in the Performance Store database:
dbo.v_query_stats
dbo.v_query_stats_current (shows query stats for the latest sample)