Introduction
With an unstoppable passion for SQL, we have made it our mission to make insights in your data available for all parts of your organization. We aim to make the complex task of administering your data as simple as possible.
We want to make it so simple – So Sequel
Performance Store was made to fill the gap in the market for SQL Server monitoring solutions, where the following was not possible:
- Give an immediate and quick overview of performance metrics for large SQL Server environments. It is not enough with a box containing a group of SQL Servers to be red or green – more detailed information and visual representations of e.g. anomalies was needed.
- Give individual teams (not only DBAs) access to information about their own systems – including information from production environments.
Performance store was made to cover these areas, and is a full fledged solution to monitor, maintain and administer large and high-performing SQL Server environments. At the same time, Performance Store is used to meet the the highest requirements for performance, security, compliance and auditing.
By November 2022 Performance Store was made publicly available.
Performance Store Features
Performance Store is a solutions to handle every aspect of maintaining and administering the SQL Server estate. This includes:
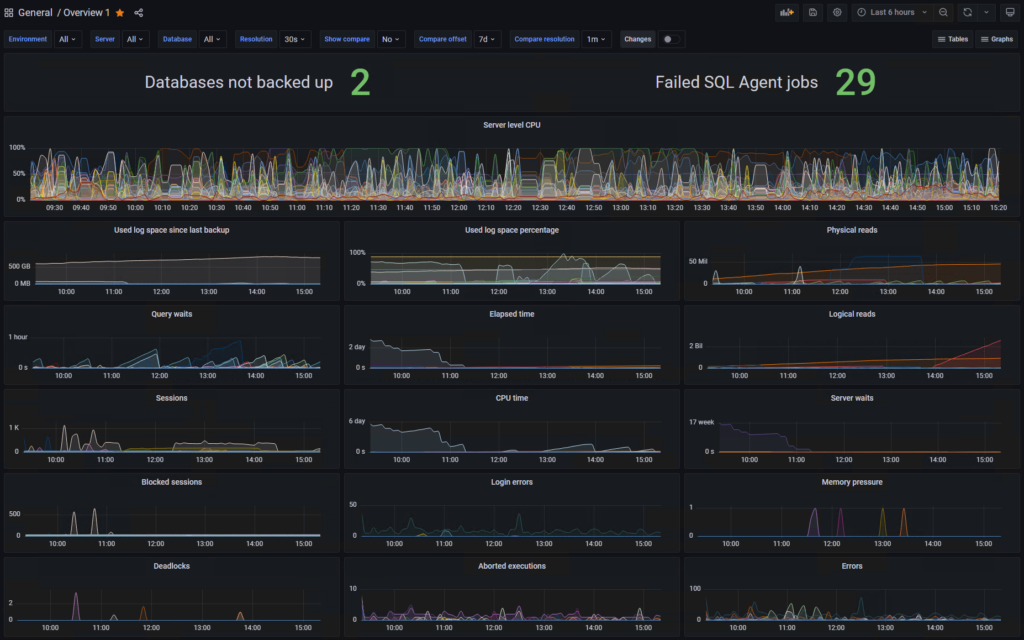
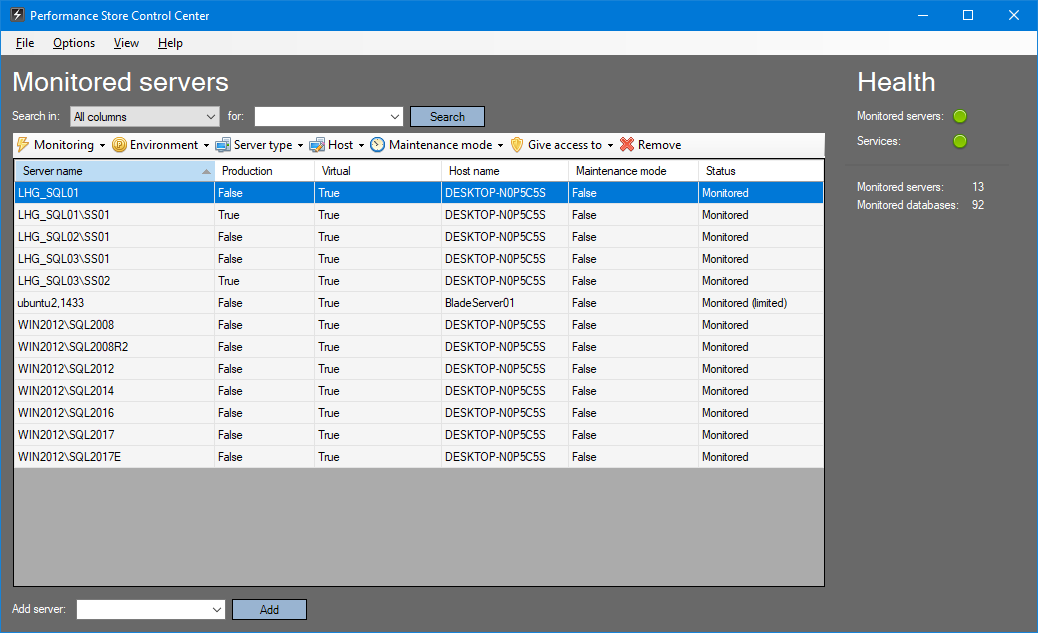
Monitoring
- Fully featured SQL Server monitoring solution.
- Fast, intuitive and responsive visual dashboards provided by Grafana.
- Visually see schema changes, errors, blockings, deadlocks, alerts, aborted executions, wait statistics and performance metrics, including baselines on all visible metrics.
- See index information, activity information, query plans and live execution plans – from aggregated data all the way down to each individual statement.
- Give different teams access to information about their own SQL Servers and databases. Sensitive data is masked by default.
- See “death by a thousand cuts” queries that normally goes under the radar.
For more information see: Dashboards, How is Performance Store different from other solutions?
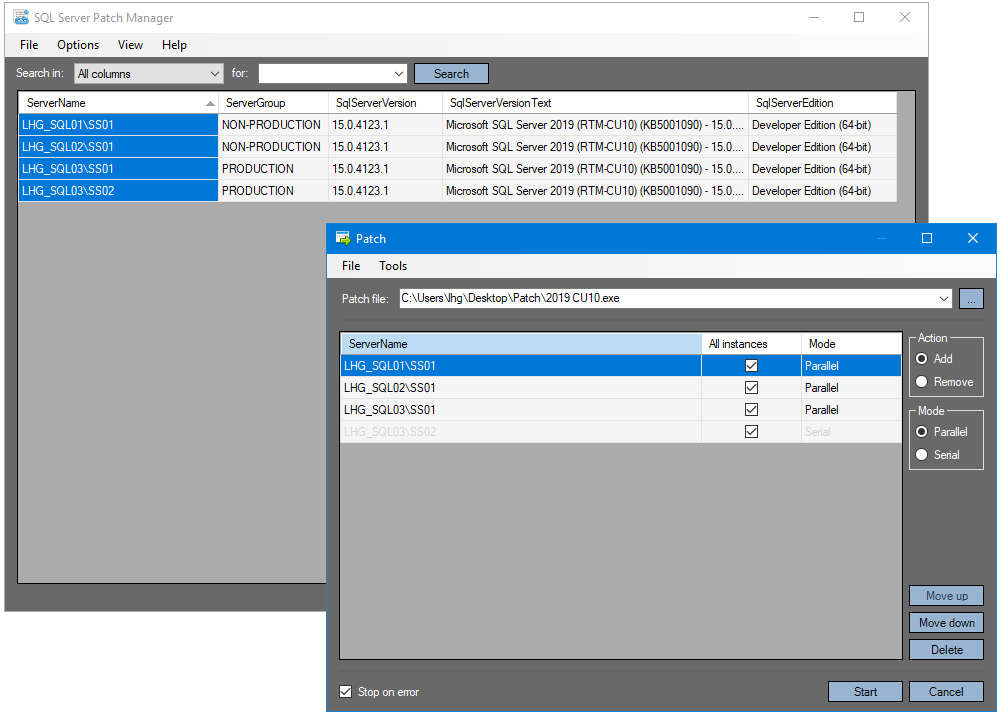
Patching
- Patch the whole SQL Servers estate in a matter of minutes.
- The SQL Server Patch Manager makes sure that primaries and secondaries are not patched on the same time to maximize uptime.
- The SQL Server Patch Manager automatically checks that Database Mirroring and AlwaysOn Availability Groups are fully functioning after patching.
For more information see: SQL Server patching
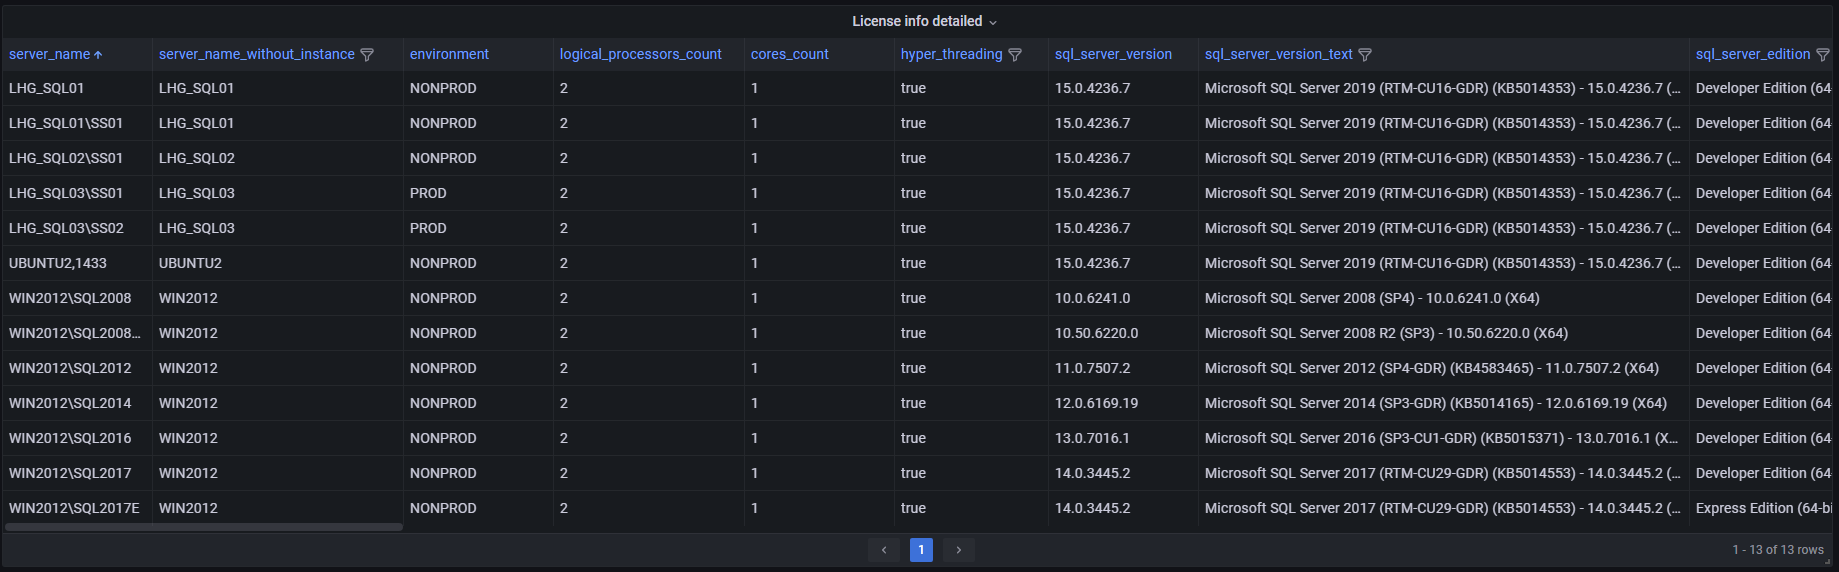
License handling
- Ease of mind knowing that the SQL Server estate is fully compliant and at the same time only using the lowest license cost possible.
- Quickly identify areas where license costs can be optimized.
- Immediately get a notification if the license costs are changing e.g. when a VM is vMotioning to a new host and thereby changing the licensing requirements.
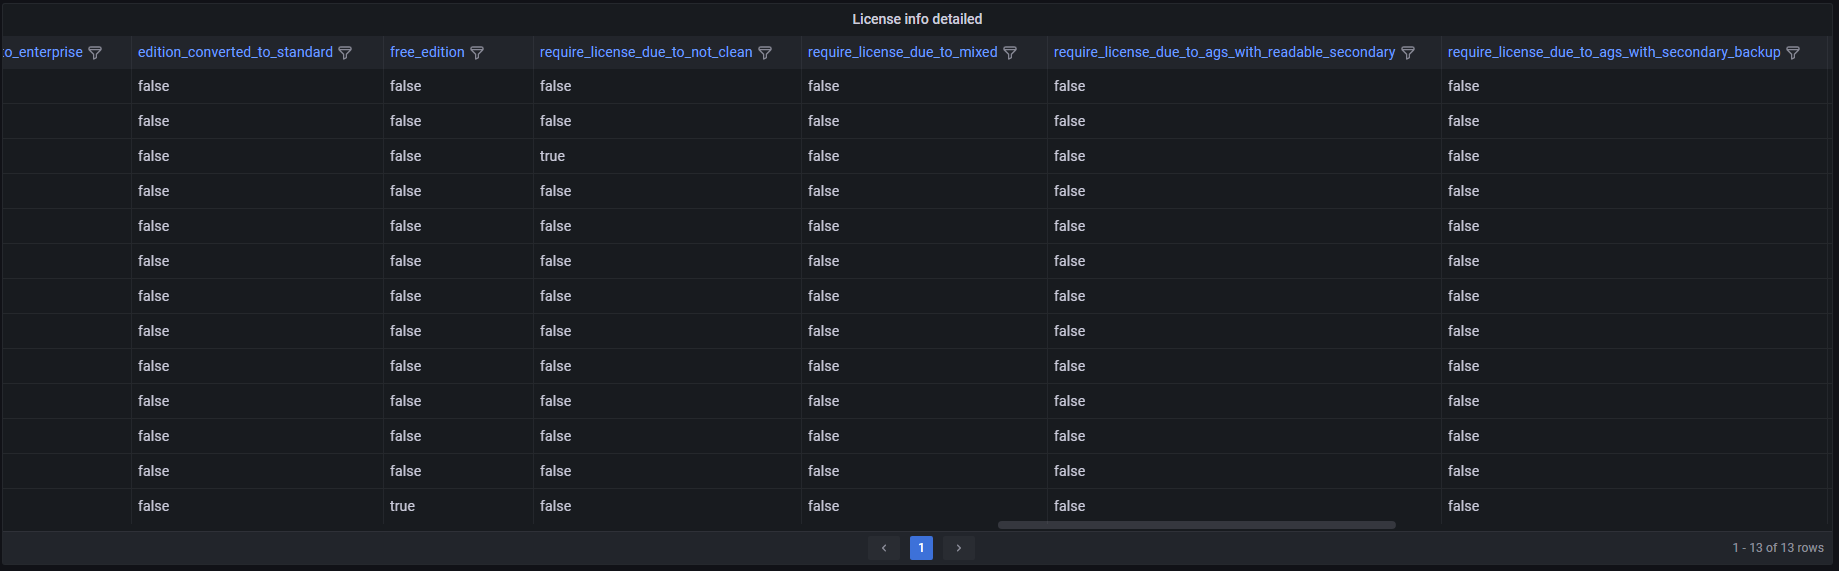
For more information see: Licensing
Database Finder
- One-stop tool to administer SQL Servers and databases across multiple domains.
- Provides centralized script repositories to different teams, e.g. one team will use a certain set of scripts and another team will use another set of scripts.
- Fully dynamic and customizable. Open scripts in PowerShell or SQL Server Management Studio and have parameter placeholders replaced with e.g. server- and database names.
- Quickly access e.g. SQL Server logs, SQL Server Agent logs, Windows Event logs and Cluster logs. Can even use any custom source as input and use the powerfull features of the log viewer to navigate, filter and sort the logs.
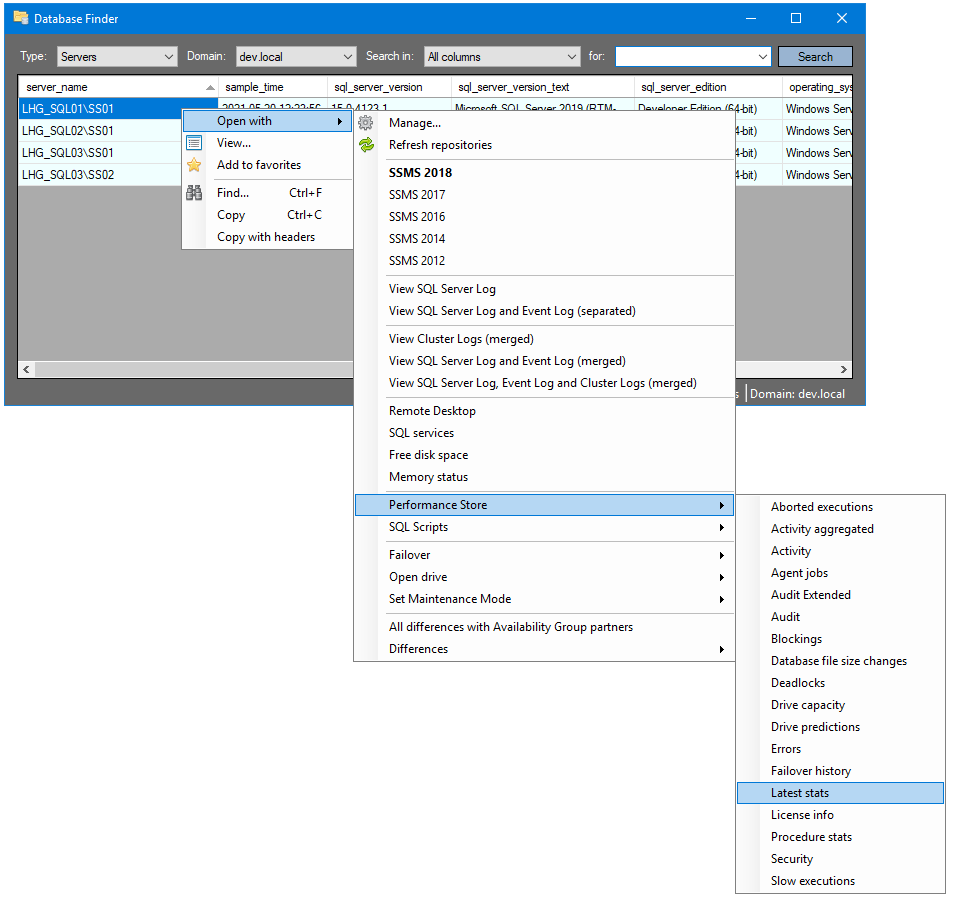
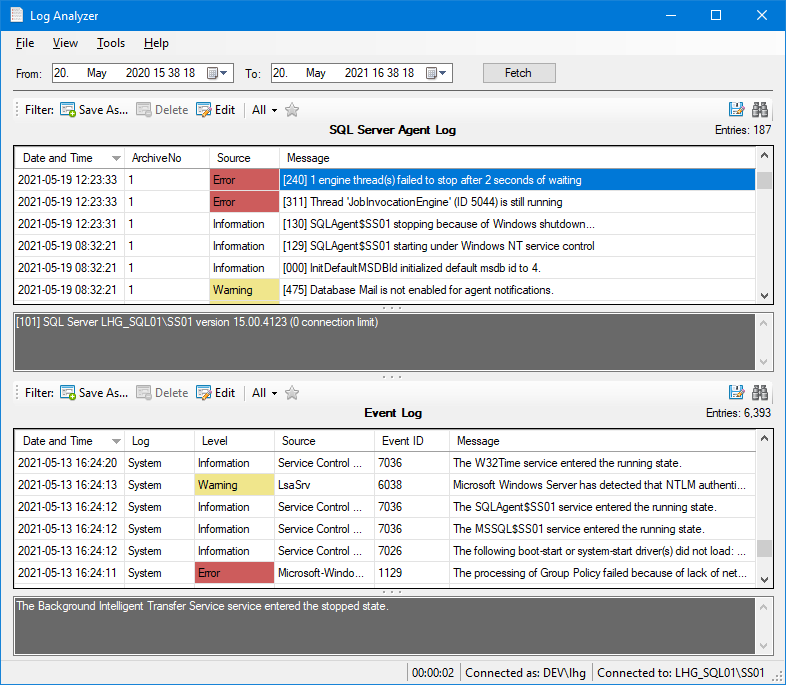
For more information see: Database Finder
Storage and capacity handling
- Capacity information for all SQL Servers and databases.
- Predictions for drive usage and database sizes, e.g. see days and hours left until empty or 20% free, how much space is used in 6 months or 12 months.
- Alerts for capacity events, so actions can be taken in a timely manner.
- See exactly what statements are the cause of a log- or data file expansion. Can be very useful to see e.g. what statement is causing excessive growth of the tempdb database.
- Visually compare capacity graphs with any given previous date, and create alerts for anomalies.
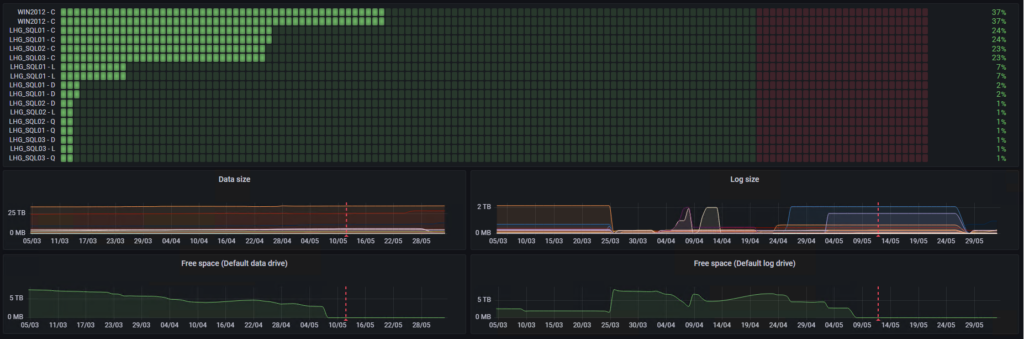
For more information see: Capacity dashboard
Auditing and compliance
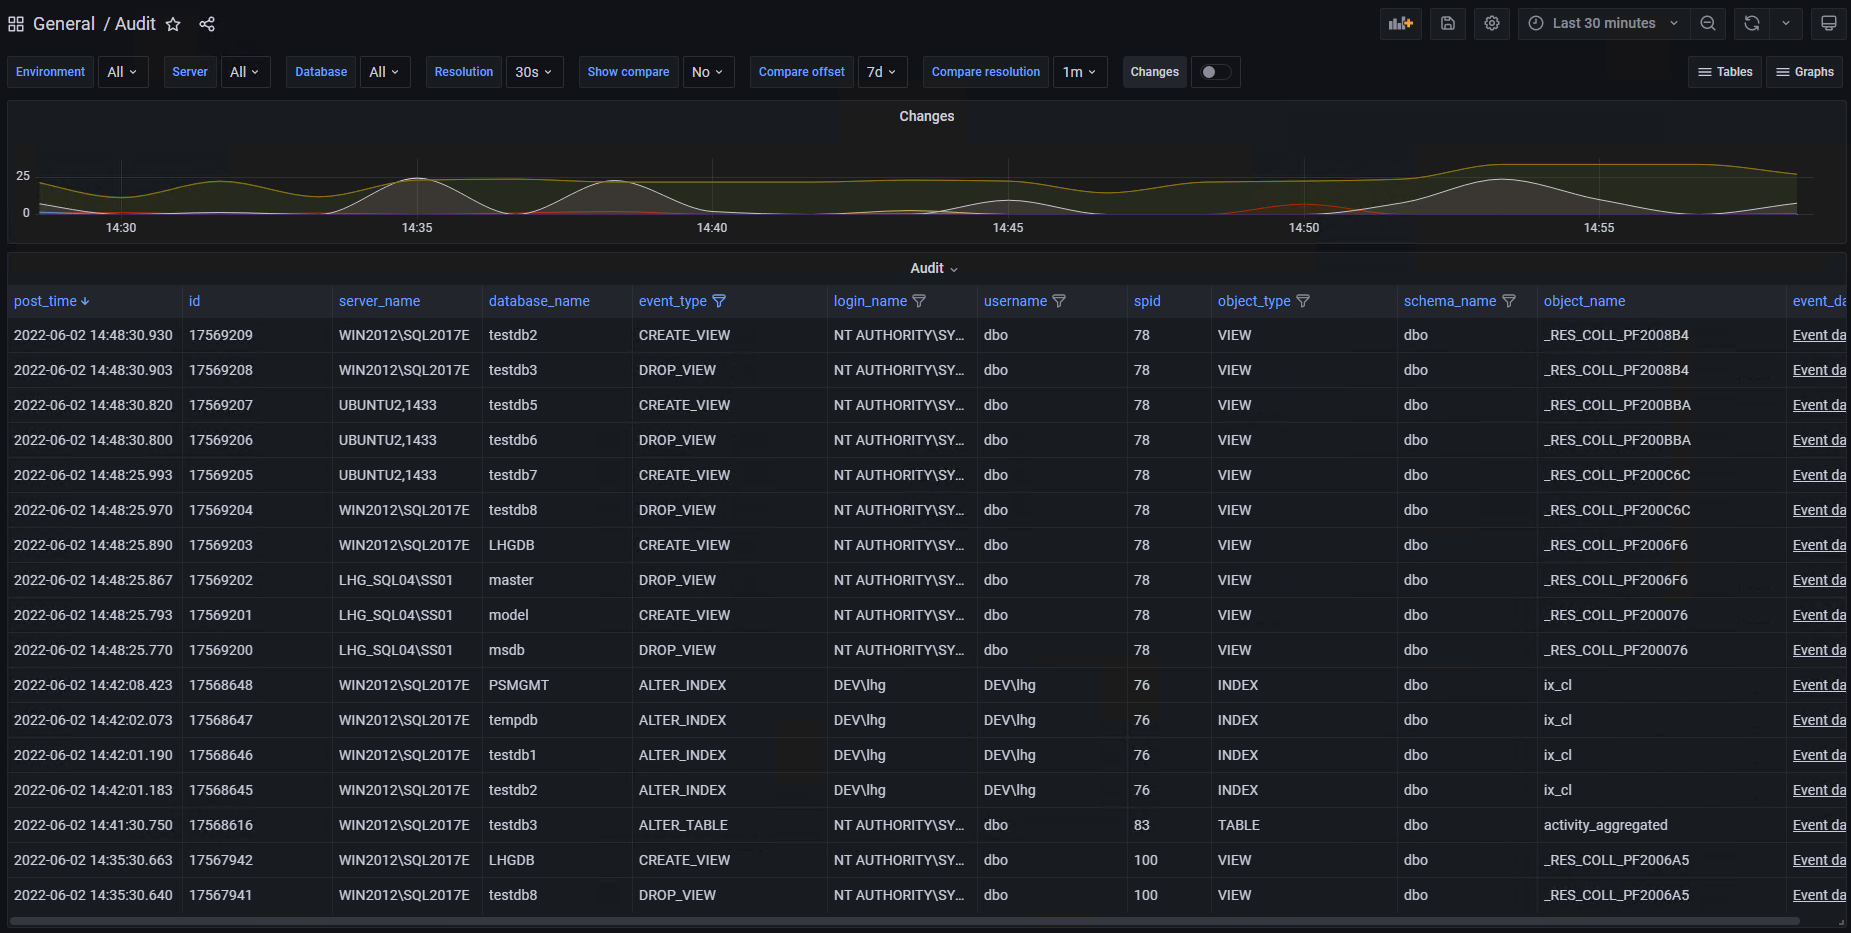
- All SQL Server schema changes are audited. Quickly identify if e.g. a stored procedure has been changed and exactly what has changed, when and by who.
- Audit who has access to servers and databases. Quickly identify e.g. all users with sysadmin privileges.
- Audit all statements, e.g. SELECT, UPDATE, DELETE and INSERT statements.
- Alerts can be created for any change. Performance Store comes with various build-in alerts e.g. when a user or group is becoming a member of the sysadmin group.
For more information see: Auditing, How is Performance Store different from other solutions?