Activity dashboard
The Activity dashboard:
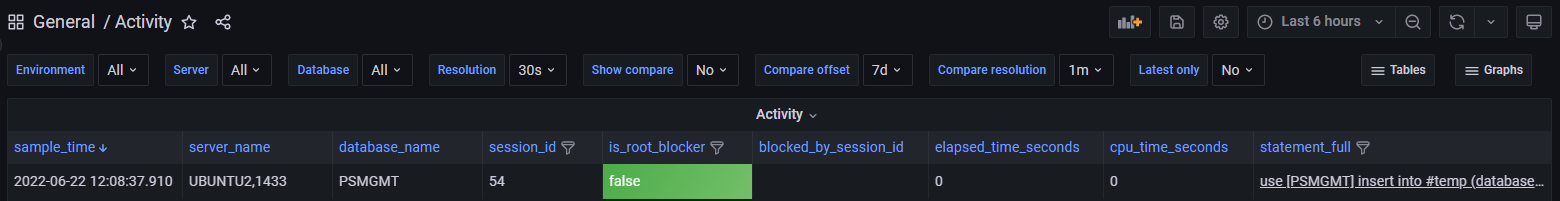
The Activity dashboard is similar to the Activity (current) dashboard, but with historical activity information. Each time Performance Store is sampling a database, it saves activity information.
By default, Performance Store samples activity every 30 seconds, so if a statement is running for more than 1 minute, it will show up multiple times in the Activity dashboard. To only show the latest activity information for long running statements, set “Latest only” to “Yes”:

Activity information is sample based, meaning it contains only activity information at exactly that time where the sample was taken. If a query was running and finished in-between two samples, it will not show in the Activity dashboard. Non-sample based activity information can be seen in the Top completed queries, Query statistics and Procedure statistics dashboards.
Query plans are available on the dashboard and the database views.
Corresponding view in the Performance Store database:
dbo.v_activity
Other relevant views in the Performance Store database:
dbo.v_activity_aggregated (shows aggregated activity information)
dbo.v_current_activity (shows activity information from the latest sample)
dbo.v_top_completed (shows information about completed or aborted queries – not sample based)