Blockings
To query the Performance Store database for aborted executions, use:
select *
from dbo.v_blockings b
order by b.sample_time desc
The following query will show all blockings going on, as well as the actual root blocker:
select a.*
from dbo.v_activity a
where 1 = 1
and a.sample_id = '[sample_id]'
and a.server_name = '[server_name]'
and a.database_name = '[database_name]'
and (a.blocked_by_session_id is not null or a.is_root_blocker = 1)
order by a.is_root_blocker desc, a.session_id
Queries being blocked for more than 20 seconds (default value, can be changed in the Settings menu), can be seen in the dbo.v_blockings view.
To see what other blockings are going on while investigating a blocking, filter on monitor_loop_id in the dbo.v_blockings view.
Note, blocking information in the dbo.v_activity view is based on snapshot samples. Blocking information in the dbo.v_blockings view contains all queries blocked for more than 20 seconds. If the activity sample functionality in Performance Store is blocked, the blocking can be seen in the dbo.v_blockings view.
A quick overview of the number of blocked sessions can be seen on the Overview 1 dashboard:
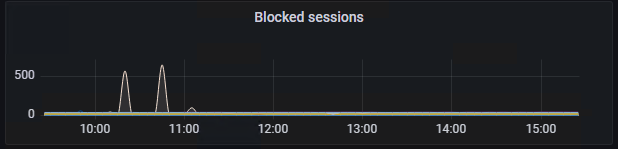
In-depth information about the blocked sessions can be seen on the Blockings dashbopard.
To exclude specific servers from this alert, see how to use the dbo.team_alert_exclude table in Alerting.